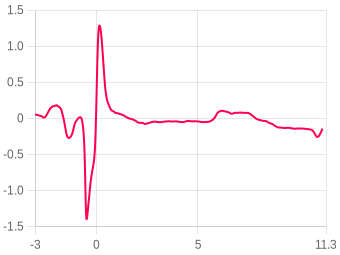
Distance
Choisissez l’unité de distance: Mètres(m), Pieds(ft), Miles(mi) ou Kilomètres(km)
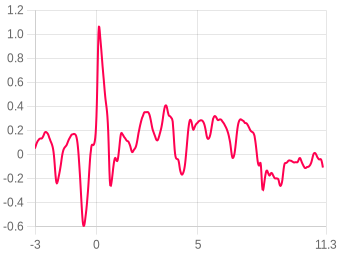
Vitesse
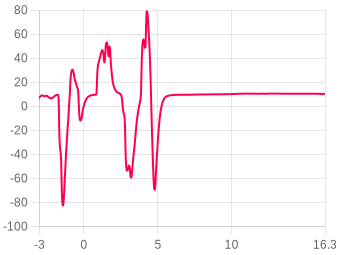
Choisissez l’unité de vitesse: m/s, ft/s, mph ou km/h
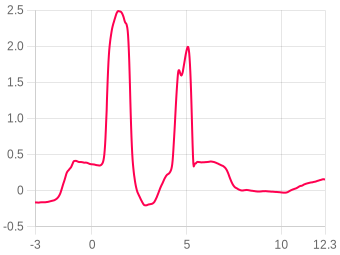
Accélération
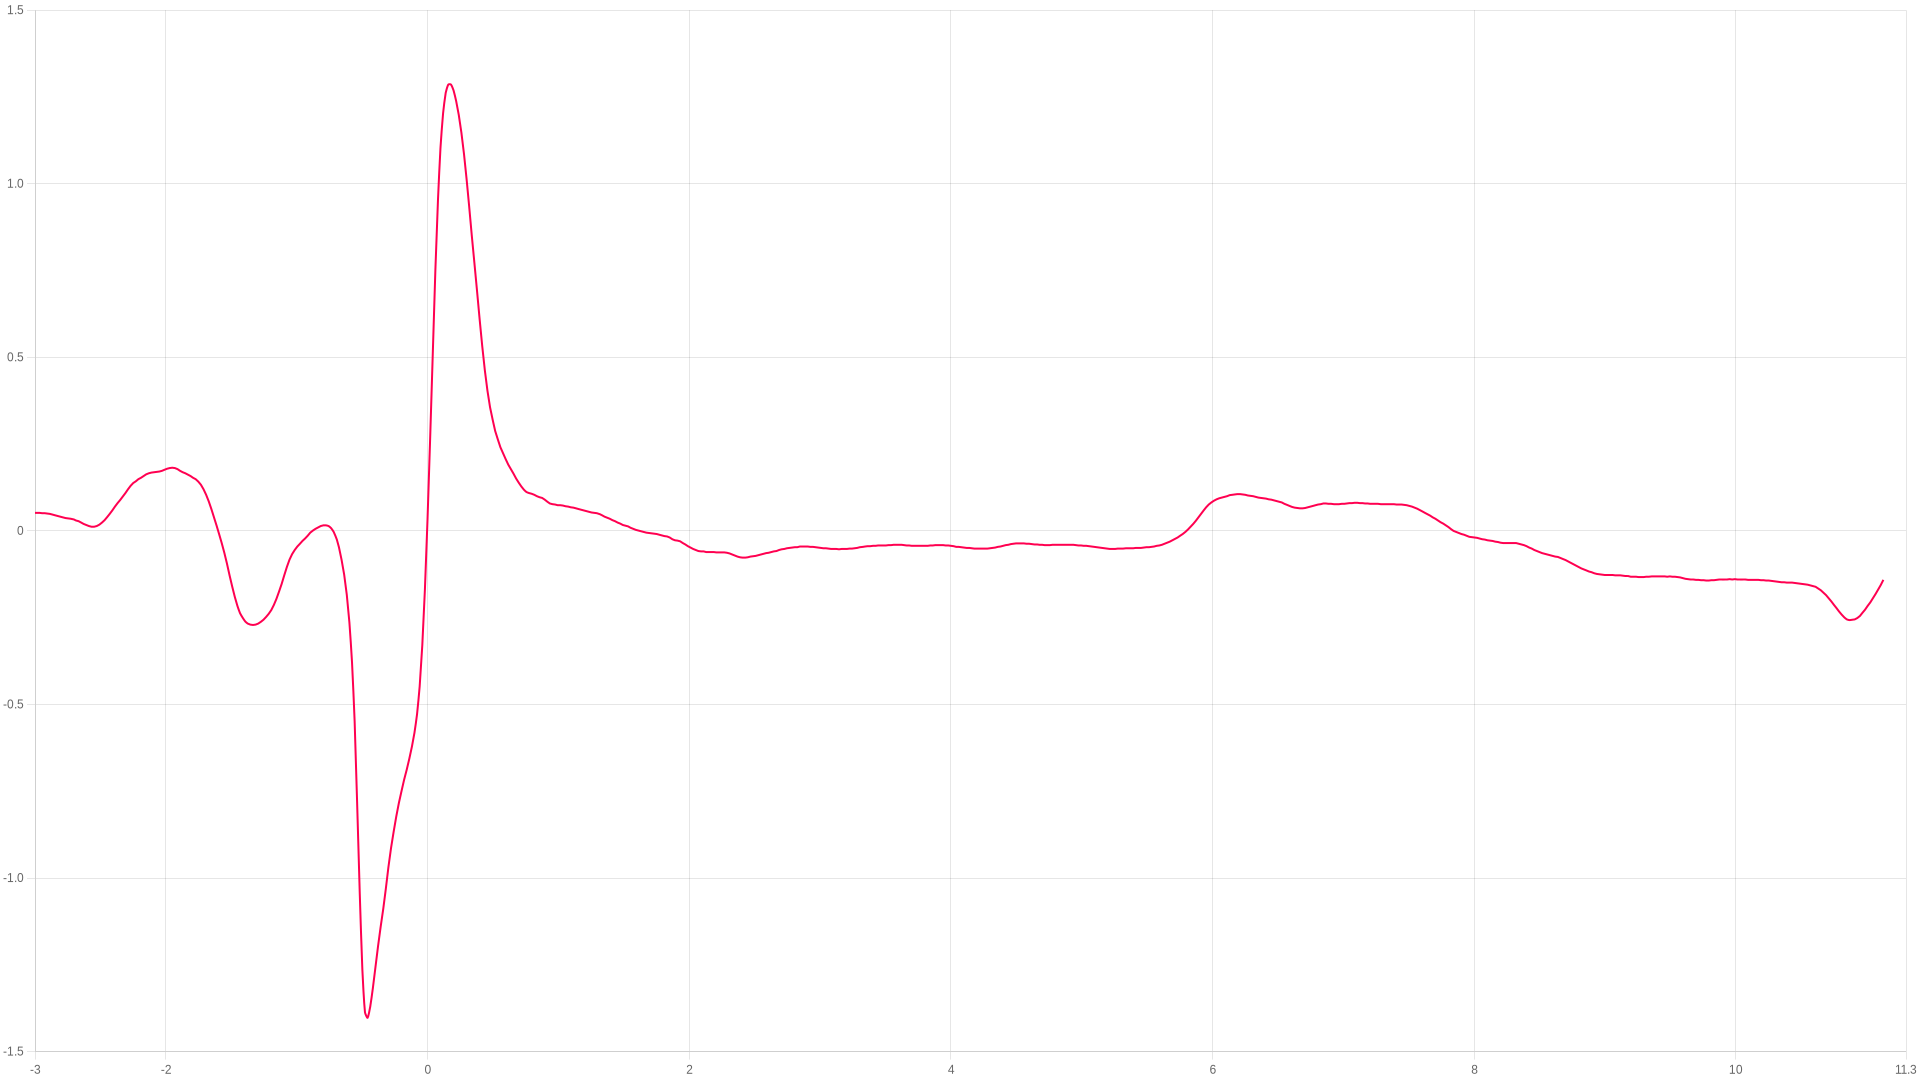
Choisissez l’unité d’accélération: m/s² ou G
Vol 1573

Flight 1573

Apogée
0m
s after launch
Max. montée
0m/s
peak ascent
Max. pendant combustion
0G
during the burn
Atterrissage
0s
touchdown 0 m/s
ZOOM TO
s
s
Afficher événements
Télécharger
Ajuster temp. & pression ?
Image
Zoom
Cliquez-glissez ou pincez sur mobile
Comparer un vol ?
Notes utilisateur
Aucune note
Ajoutez cet appareil à votre compte pour modifier
Vidéo Youtube
Aucune vidéo
Ajoutez cet appareil à votre compte pour modifier
Images du vol 0
Aucune image
Flown as
Rocket
None
not linked
Motor configuration
None
no motor recorded
Loaded weight
None
not entered
Moteurs du vol
Aucun moteur ajouté à ce vol
Ajoutez cet appareil à votre compte pour modifier
Fusée associée
Aucune fusée associée à ce vol

Linked flights

Connect flights that belong together: a second altimeter flown in the same rocket, or the same rocket flown again. Linked flights appear on each other’s pages.

No linked flights yet.

Site de lancement, date & heure

Cliquez sur la carte pour marquer votre site de lancement. Basculez entre vue carte et satellite.

Imagery © Esri, Maxar, Earthstar Geographics

Cliquez sur la carte · Glissez pour ajuster

Canopy height from the Meta and WRI High Resolution Canopy Height Maps v2 (Meta and World Resources Institute, 2026; source imagery © 2016 Vantor), used under CC BY 4.0. Ground elevation built from Terrain Tiles (Mapzen and AWS Open Data), derived from 3DEP and GMTED courtesy of the U.S. Geological Survey, SRTM courtesy of NASA, and ETOPO1 courtesy of NOAA. Map and imagery credited on the view above.

No launch site has been set for this flight.

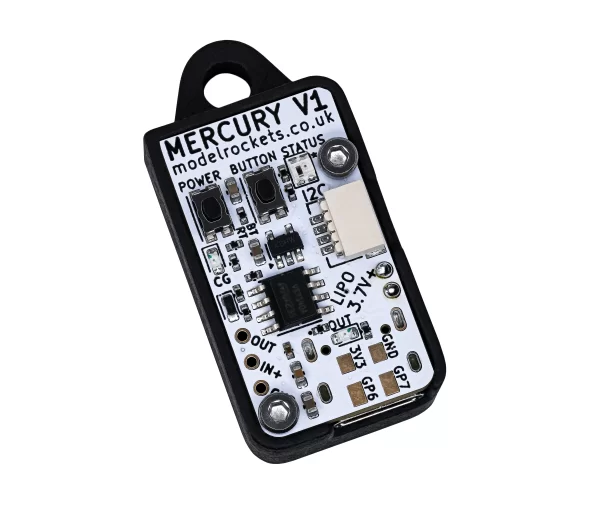
Mercury V1
Revision 0
Mercury V1
Ce vol a été effectué sur un Mercury V1.
The hardware
Version matérielRev 0
Version logiciel
Dernière connexion27-Apr at 17:35
Capteur pressionBosch BMP 390
Accéléromètre32G 3-axis
Gyroscope2000 dgps 3-axis
MagnétomètreN/A

Settings, as they were for this flight

Paramètres généraux
Pression prévue
i
Set this to your local forecast pressure at sea level. This will offer you slightly improved accuracty for your flight, although it's not 100% essential every little helps!

Xcweather.co.uk is a decent place to grab pressures from for your location and time.
1013.25 mbar
Détection lancement
i
This is the altitude above the launch pad altitude where the altimeter will trigger itself into recording / flight mode.

The altimeter keeps a constant average of the pressure while waiting for launch, it uses a simple algorithm and the pre-flight buffers to do this. The most recent 120 samples (~4 seconds) are ignored so your pre-trigger altitude won't effect the ground baseline.

For almost all uses we suggest keeping this on the 25 Meter (~82 feet) default settings. If you want to test your altimeter by throwing it in the air, or are planning a very low flight you may want to lower the setting.
meters
Fréquence échantillonnage
i
The base sample rate of the altimeter's sensors in samples per second. This setting was deprecated in firmware 2.0+.
32 Hz
Ratio échantillonnage
i
The altimeter runs at 50Hz however you can record every sample or every X samples in order to extend the log time. For example if you set the ratio to 1 it will save 1:1 samples, or if you set it to 3 it will save 1 in 3 samples.
1:1 (50Hz)
Max. échantillons
i
This is the maximum samples the altimeter will log per flight. When it reaches this amount it will stop and save the recording.
12000
Arrêt enregistrement
i
This setting is how the altimeter decides to stop recording. You can choose either 450 (~9s) or 900 (~18s) samples stable or it will record until the max samples limit unless you press the BUTTON in Manual stop mode.

The samples stable method waits for the devices altitude not to change for the set number of samples. This is defined by not changing by more than +/- 1.0 meters for 98% of the samples, it's a reliable method to stop the recording after landing within 8-10 seconds (300 sample) or 16-20 seconds (600 sample).
Suréchantillonnage
i
Oversampling is a internal setting of the BMP 390 pressure sensor. It is how many samples are taken for each reading. By taking multiple samples for each pressure reading the altimeter reduces noise and increases the resolution of the output.

The sensor can run at 50 samples per second in 4X mode, so we suggest leaving it in this mode as it will offer the highest accuracy.
DÉSACTIVÉ
Filtre IIR
i
The IIR filter is another internal sensor for the BMP390 pressure sensor. It is a Infinite impulse response filter used to enhance pressure measurement accuracy by reducing noise. It's primarily for smoothing out rapid pressure changes.

We suggest not setting this too high as it will cause delay to changes in altitude if set very high.
DÉSACTIVÉ
Filtre pression
i
This filter is a software Kalman filter that runs on the altimeters processor.

The Kalman filter uses a prediction step based on a system model and then a correction step using new measurements to refine its estimate, it creates accurate most certain results from data with noise in it.
Verrouillage lancement
i
When enabled, the altimeter locks out recording for a set period after power on to prevent false triggering during setup.
DISABLED
Température statique
i
A fixed temperature value used for altitude calculation when the external temperature sensor is disabled or not connected.
15.00 °C

Files

Where the altimeter signs its log, the file carries that signature and a tick beside it. A tick means the data is unchanged since the device wrote it, which is what a record claim needs.
CSV
1573.csv
The log as columns of text. Opens in a spreadsheet, and in every simulator that reads flight data.
71 KB
Adjusted CSV2904 recalculated in your browser
The log recomputed for your own sea-level pressure and temperature. Columns: time, altitude as recorded and adjusted, raw altitude as recorded and adjusted, pressure.

This file is built here from the signed log, so it carries no signature of its own. Anyone verifying a claim should be sent to the flight page and build their own from the original.

Custom CSVbuilt in your browser
Pick any of the chart’s data sets, the worked-out ones included, and the part of the flight to cover. Values come in the units the chart is set to.
In the file
Time span

One row for every time any chosen data set has a sample. A data set with no sample at that time is left blank rather than filled in. Built from the chart’s data, so it carries no signature.

Vol
Commentaires
Connectez-vous pour commenter.