Distância
Escolha a unidade de distância: Metros(m), Pés(ft), Milhas(mi) ou Quilômetros(km)
Velocidade
Escolha a unidade de velocidade: m/s, ft/s, mph ou km/h
Aceleração
Escolha a unidade de aceleração: m/s² ou G
Voo 2900

Flight 2900

FlightSketch Mini · imported log
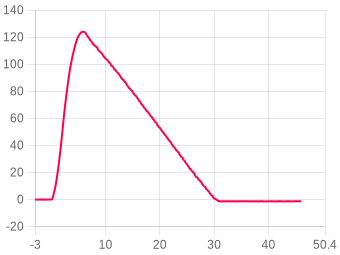
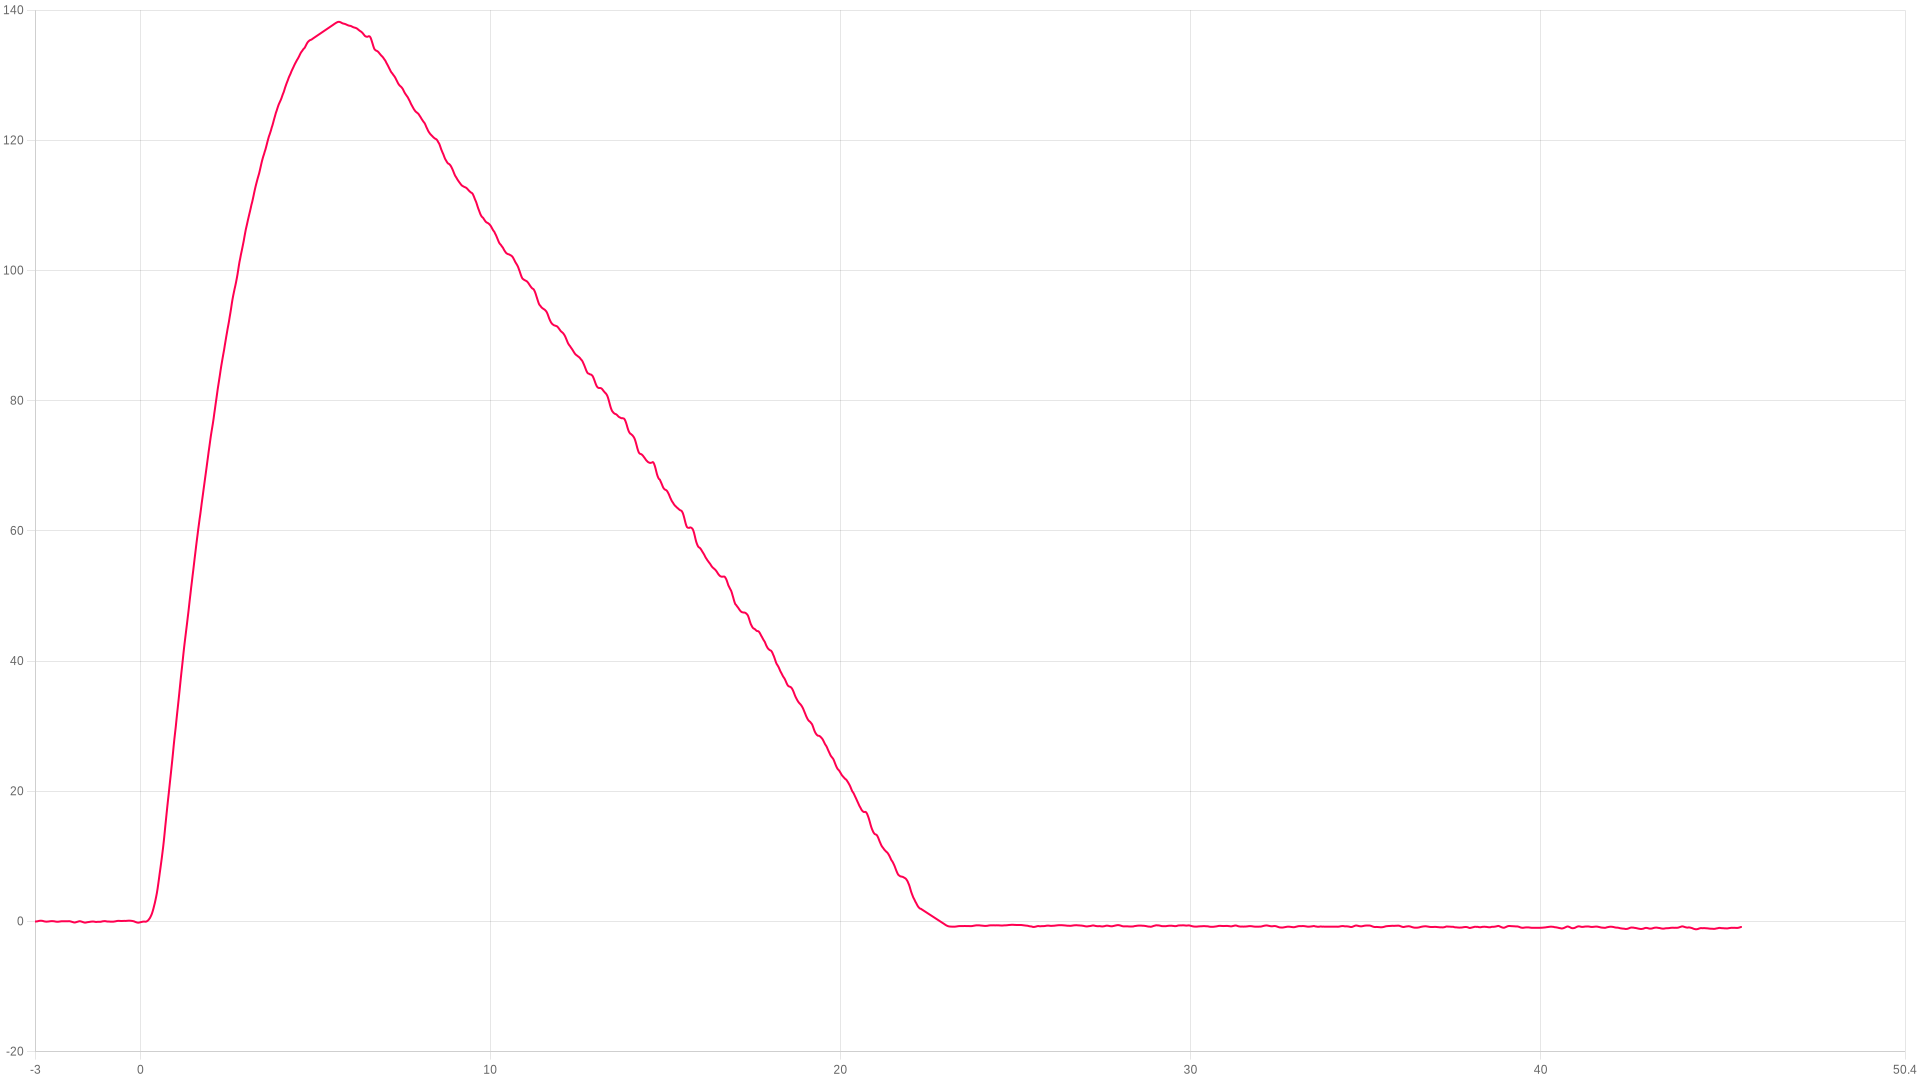
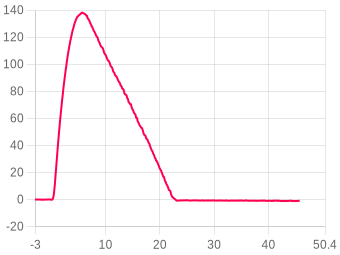
Apogeu
138.21m
5.68 s after launch
Máx. subida
51.76m/s
peak ascent
Máx. durante combustão
0.01G
during the burn
Aterragem
22.72s
touchdown 8.35 m/s
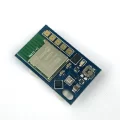
FlightSketch Mini
Third party device
This log was uploaded from a FlightSketch Mini, a non AltimeterCloud device.
ZOOM TO
s
s
Mostrar eventos
Transferir
Ajustar temp. & pressão ?
Imagem
Zoom
Clique e arraste, ou belisque no telemóvel
Comparar voo ?
Resumo do voo

The flight, moment by moment

Liftoff
0 s
Found byFlightSketch Mini
Logging50/s
Burnout
0 s
Altitude-0.14 m
Velocidade57.220 m/s
Ejection
0.01 s
Apogeu
5.68 s
Altitude138.21 m
TruePath apogee138.21 m
Log ends
45.74 s
Altitude-0.85 m
Logging50/s
Altitude
Apogeu138.21 m
Tempo até apogeu5.68 s
Apogee, TruePath138.21 m at 5.68 s
Apogee stated by the FlightSketch Mini138.31 m
Highest raw altitude138.52 m at 5.26 s
Highest altitude as the FlightSketch Mini recorded it138.31 m at 5.62 s
Velocidade
Max ascent, TruePath51.76 m/s at 0.94 s
Max ascent, raw (device)57.25 m/s at 0.84 s
Max descent, TruePath-14.26 m/s at 16.9 s
Typical descent rate, TruePath3.26 m/s
Velocity at burnout57.220 m/s
Max acceleration (device)27.74 G at 22.52 s
Max acceleration total as the FlightSketch Mini recorded it27.74 G at 22.52 s
Tempos
Liftoff0 s
Burnout0 s
Ejection0.01 s
Log ends45.74 s
Geral
AltimeterFlightSketch Mini
Log formatFlightSketch
Amostras de dados2506
Tempo total gravação50.101 s
Logging rate50/s
Imported from the log file the FlightSketch Mini wrote. Its own figures are shown as it recorded them; the TruePath figures are worked out here on the website from its altitude column.
Notas do utilizador
Sem notas
Adicione este dispositivo à sua conta para editar
Vídeo Youtube
Sem vídeo
Adicione este dispositivo à sua conta para editar
Imagens do voo 0
Sem imagens
Flown as
Rocket
None
not linked
Motor configuration
None
no motor recorded
Loaded weight
None
not entered
Motores do voo
Nenhum motor adicionado a este voo
Adicione este dispositivo à sua conta para editar
Foguete associado
Nenhum foguete associado a este voo

Linked flights

Connect flights that belong together: a second altimeter flown in the same rocket, or the same rocket flown again. Linked flights appear on each other’s pages.

No linked flights yet.

Local de lançamento, data e hora

Clique no mapa para marcar o local de lançamento. Alterne entre vista de mapa e satélite.

Imagery © Esri, Maxar, Earthstar Geographics

Clique no mapa · Arraste para ajustar

Canopy height from the Meta and WRI High Resolution Canopy Height Maps v2 (Meta and World Resources Institute, 2026; source imagery © 2016 Vantor), used under CC BY 4.0. Ground elevation built from Terrain Tiles (Mapzen and AWS Open Data), derived from 3DEP and GMTED courtesy of the U.S. Geological Survey, SRTM courtesy of NASA, and ETOPO1 courtesy of NOAA. Map and imagery credited on the view above.

No launch site has been set for this flight.

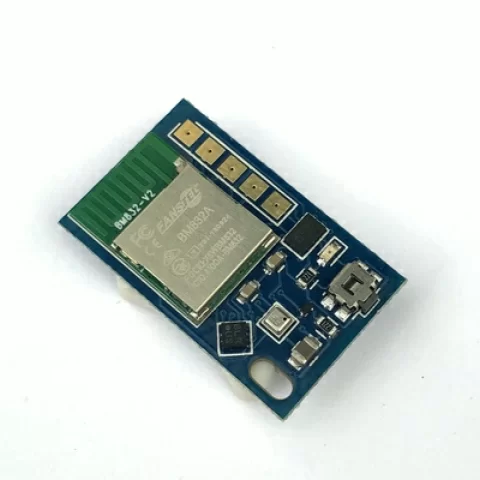
FlightSketch MiniFlightSketch Mini
FlightSketch Mini
FlightSketch
FlightSketch Mini
This flight was recorded on a FlightSketch Mini, another make of altimeter, and imported from its log file.
The hardware
MakerFlightSketch
ModelFlightSketch Mini
SensorsBosch BMP388 baro, Bosch BMA253 accelerometer, Nordic nRF52811
Log formatFlightSketch

The log

Other makes of altimeter keep their settings on the device and do not write them into the log, so there are none to show here. This is what the file itself told us.
This flight
Log formatFlightSketch
Amostras de dados2506
Tempo total gravação50.101 s
Logging rate50 per second
ProcessingTruePath, on the website
Getting logs off the FlightSketch Mini
Open the flight on the FlightSketch website and use the "Download Data (.csv)" link below the acceleration chart. Upload that file unchanged.

Files

Where the altimeter signs its log, the file carries that signature and a tick beside it. A tick means the data is unchanged since the device wrote it, which is what a record claim needs.
CSV
2900.csv
The log as columns of text. Opens in a spreadsheet, and in every simulator that reads flight data.
239 KB
Adjusted CSV2904 recalculated in your browser
The log recomputed for your own sea-level pressure and temperature. Columns: time, altitude as recorded and adjusted, raw altitude as recorded and adjusted, pressure.

This file is built here from the signed log, so it carries no signature of its own. Anyone verifying a claim should be sent to the flight page and build their own from the original.

Custom CSVbuilt in your browser
Pick any of the chart’s data sets, the worked-out ones included, and the part of the flight to cover. Values come in the units the chart is set to.
In the file
Time span

One row for every time any chosen data set has a sample. A data set with no sample at that time is left blank rather than filled in. Built from the chart’s data, so it carries no signature.

Voo
Comentários
Iniciar sessão para comentar.