Distance
You can choose which units to use for distance from Meters(m), Feet(ft), Miles(mi) & Kilometers(km)
Velocity
You can pick which units to use for Velocity/speed such as Meters per second (m/s), Feet per second (ft/s), Miles per hour (mph) and Kilometers per hour (kph)
Acceleration
You can choose acceleration units to display from either Meters per second squared (m/s^2) or Gravity (G)
Flight 2899

Flight 2899

FlightSketch Mini · imported log
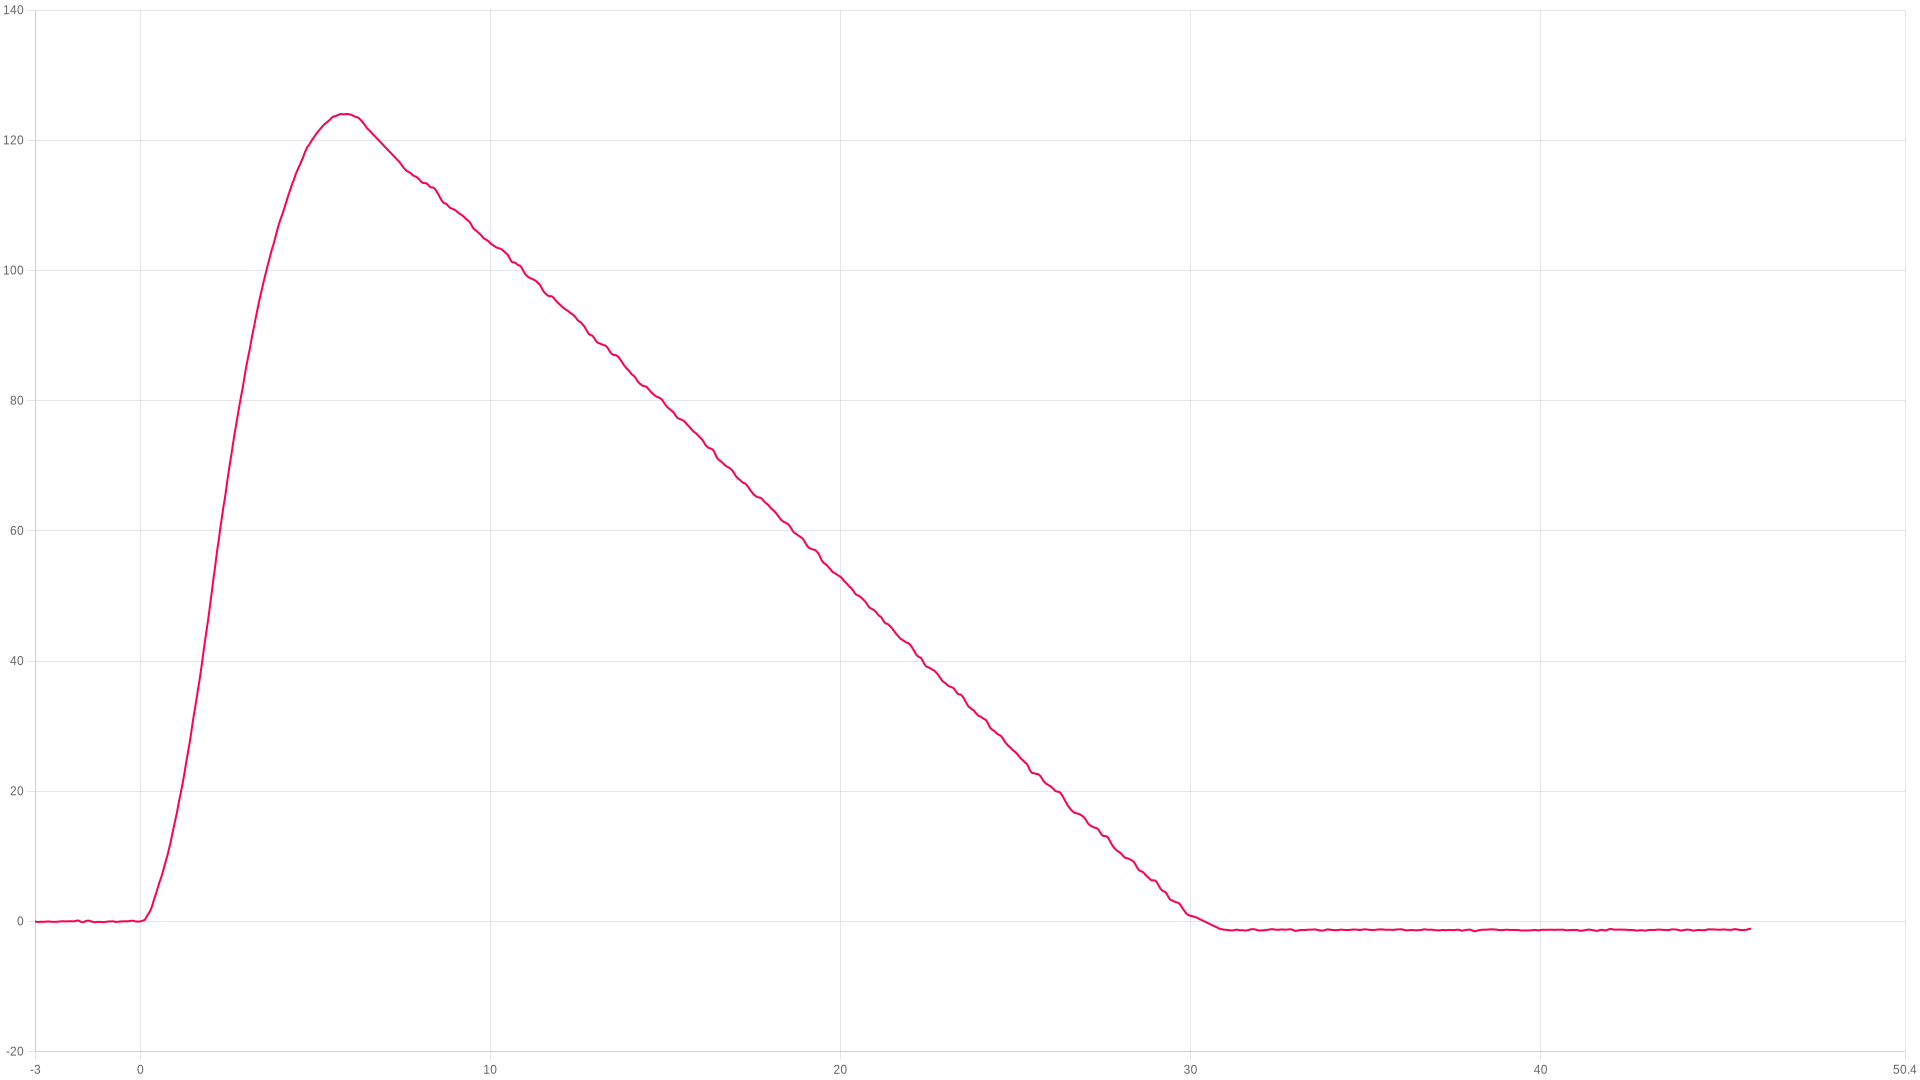
Apogee
124.05m
5.92 s after launch
Max ascent
41.29m/s
peak ascent
Max during burn
0G
during the burn
Landing
30.32s
touchdown 4.71 m/s
FlightSketch Mini
Third party device
This log was uploaded from a FlightSketch Mini, a non AltimeterCloud device.
ZOOM TO
s
s
Show events
Download
Adjust temp & pressure ?
Image
Zooming
Drag to zoom, pinch on mobile
Compare flight ?
Flight summary

The flight, moment by moment

Liftoff
0 s
Found byFlightSketch Mini
Logging50/s
Burnout
0 s
Altitude0 m
Velocity43.700 m/s
Ejection
0.01 s
Apogee
5.92 s
Altitude124.05 m
TruePath apogee124.05 m
Log ends
46 s
Altitude-1.09 m
Logging50/s
Altitude
Apogee124.05 m
Time to apogee5.92 s
Apogee, TruePath124.05 m at 5.92 s
Apogee stated by the FlightSketch Mini124.48 m
Highest raw altitude127.64 m at 6.9 s
Highest altitude as the FlightSketch Mini recorded it124.47 m at 5.72 s
Velocity
Max ascent, TruePath41.29 m/s at 2.08 s
Max ascent, raw (device)43.71 m/s at 2.16 s
Max descent, TruePath-9.02 m/s at 26.42 s
Typical descent rate, TruePath3.58 m/s
Velocity at burnout43.700 m/s
Max acceleration (device)27.74 G at 6.9 s
Max acceleration total as the FlightSketch Mini recorded it27.74 G at 6.9 s
Times
Liftoff0 s
Burnout0 s
Ejection0.01 s
Log ends46 s
General
AltimeterFlightSketch Mini
Log formatFlightSketch
Data samples2506
Total recording time50.101 s
Logging rate50/s
Imported from the log file the FlightSketch Mini wrote. Its own figures are shown as it recorded them; the TruePath figures are worked out here on the website from its altitude column.
User notes
No notes added
Add this device to your account to edit
Youtube video
No video added
Add this device to your account to edit
Flight images 0
No images added
Flown as
Rocket
None
not linked
Motor configuration
None
no motor recorded
Loaded weight
None
not entered
Flight motors
No motors have been added to this flight
Add this device to your account to edit
Linked rocket
No rocket linked to this flight

Linked flights

Connect flights that belong together: a second altimeter flown in the same rocket, or the same rocket flown again. Linked flights appear on each other’s pages.

!The altimeters aboard disagree on apogee by 98.1%
Apogee spread2.4 – 124.05 m
#2904 · Nano V1Same flight · another altimeter2.4 mView flight →

Launch site, date & time

Click anywhere on the map to mark your launch site. Switch between map and satellite view using the buttons below.

Imagery © Esri, Maxar, Earthstar Geographics

Click the map to place a marker · Drag to adjust

Canopy height from the Meta and WRI High Resolution Canopy Height Maps v2 (Meta and World Resources Institute, 2026; source imagery © 2016 Vantor), used under CC BY 4.0. Ground elevation built from Terrain Tiles (Mapzen and AWS Open Data), derived from 3DEP and GMTED courtesy of the U.S. Geological Survey, SRTM courtesy of NASA, and ETOPO1 courtesy of NOAA. Map and imagery credited on the view above.

No launch site has been set for this flight.

FlightSketch MiniFlightSketch Mini
FlightSketch Mini
FlightSketch
FlightSketch Mini
This flight was recorded on a FlightSketch Mini, another make of altimeter, and imported from its log file.
The hardware
MakerFlightSketch
ModelFlightSketch Mini
SensorsBosch BMP388 baro, Bosch BMA253 accelerometer, Nordic nRF52811
Log formatFlightSketch

The log

Other makes of altimeter keep their settings on the device and do not write them into the log, so there are none to show here. This is what the file itself told us.
This flight
Log formatFlightSketch
Data samples2506
Total recording time50.101 s
Logging rate50 per second
ProcessingTruePath, on the website
Getting logs off the FlightSketch Mini
Open the flight on the FlightSketch website and use the "Download Data (.csv)" link below the acceleration chart. Upload that file unchanged.

Files

Where the altimeter signs its log, the file carries that signature and a tick beside it. A tick means the data is unchanged since the device wrote it, which is what a record claim needs.
CSV
2899.csv
The log as columns of text. Opens in a spreadsheet, and in every simulator that reads flight data.
242 KB
Adjusted CSV2904 recalculated in your browser
The log recomputed for your own sea-level pressure and temperature. Columns: time, altitude as recorded and adjusted, raw altitude as recorded and adjusted, pressure.

This file is built here from the signed log, so it carries no signature of its own. Anyone verifying a claim should be sent to the flight page and build their own from the original.

Custom CSVbuilt in your browser
Pick any of the chart’s data sets, the worked-out ones included, and the part of the flight to cover. Values come in the units the chart is set to.
In the file
Time span

One row for every time any chosen data set has a sample. A data set with no sample at that time is left blank rather than filled in. Built from the chart’s data, so it carries no signature.

Flight
Comments
Sign in to leave a comment.