
























Imagery: World Imagery, Esri, Maxar, Earthstar Geographics, and the GIS User Community. Powered by Esri.
Wind turbines: U.S. Wind Turbine Database (USGS, LBNL and ACP), public domain, doi:10.5066/F7TX3DN0; Datenquelle: Marktstammdatenregister, Bundesnetzagentur, Datenlizenz Deutschland - Namensnennung - Version 2.0; Kilde: Energistyrelsen, stamdataregister for vindkraftanlæg; Länsstyrelserna, Vindbrukskollen, CC0; contains information licensed under the Open Government Licence - Canada (Canadian Wind Turbine Database, Natural Resources Canada); RIVM Atlas Leefomgeving, public domain; contains data under the Norwegian licence for Open Government data (NLOD) made available by NVE; OpenStreetMap data © OpenStreetMap contributors, ODbL.
Maps: Topographic map © OpenStreetMap contributors, SRTM; map style © OpenTopoMap (CC-BY-SA). Street map © OpenStreetMap contributors.
Ground height: Terrain Tiles (Mapzen / Tilezen, on AWS Open Data), reduced into resolution tiers by Altimeter Cloud: ArcticDEM terrain data DEM(s) were created from DigitalGlobe, Inc., imagery and funded under National Science Foundation awards 1043681, 1559691, and 1542736; Australia terrain data © Commonwealth of Australia (Geoscience Australia) 2017; Austria terrain data © offene Daten Österreichs – Digitales Geländemodell (DGM) Österreich; Canada terrain data contains information licensed under the Open Government Licence – Canada; Europe terrain data produced using Copernicus data and information funded by the European Union - EU-DEM layers; Global ETOPO1 terrain data U.S. National Oceanic and Atmospheric Administration; Mexico terrain data source: INEGI, Continental relief, 2016; New Zealand terrain data Copyright 2011 Crown copyright (c) Land Information New Zealand and the New Zealand Government (All rights reserved); Norway terrain data © Kartverket; United Kingdom terrain data © Environment Agency copyright and/or database right 2015. All rights reserved; United States 3DEP (formerly NED) and global GMTED2010 and SRTM terrain data courtesy of the U.S. Geological Survey.
Weather: Weather data by Open-Meteo.com (CC BY 4.0), from the NOAA Global Forecast System, held and read for these sites by Altimeter Cloud; ensemble from the NOAA Global Ensemble Forecast System, NOAA Open Data on AWS, NOAA National Centers for Environmental Prediction. Its use here implies no endorsement by NOAA.
Trees: Version 2 High Resolution Canopy Height Maps by WRI and Meta, accessed in September 2026 from registry.opendata.aws/dataforgood-fb-forestsv2. Meta and World Resources Institute (WRI) - 2026. Version 2 High Resolution Canopy Height Maps (CHMv2). Source imagery for CHM © 2016 Vantor, CC BY 4.0; where that is not yet in the database, ETH Global Canopy Height 2020, CC BY 4.0, Lang, N., Jetz, W., Schindler, K. and Wegner, J. D. (2023), A high-resolution canopy height model of the Earth, Nature Ecology & Evolution. Both reduced to height bands by Altimeter Cloud.
Water: © ESA WorldCover project 2021 / Contains modified Copernicus Sentinel data (2021) processed by ESA WorldCover consortium (CC BY 4.0), and OpenStreetMap data © OpenStreetMap contributors, ODbL; combined and reduced to 10 m cells by Altimeter Cloud.
Roads, railways and power lines: OpenStreetMap data © OpenStreetMap contributors, ODbL; reduced to 10 m cells by class, and pylon heights estimated from line voltage where none is mapped, by Altimeter Cloud.
Place search: Photon by komoot, from OpenStreetMap data © OpenStreetMap contributors, ODbL.
Launch site
Where you are flying from, and when. Search for a place, type its position, or pick it on the map.
Rocket
The rocket and its recovery.
Flight
How this flight goes: the rail, how high each stage gets, and how it comes down.
Radio
How much of the landing zone your LoRa receiver hears from where you stand (the You figure on the map), and where to walk to hear more.
Know where your rocket will land before you fly
Choose your launch site and time, load your rocket, and the Launch Site Survey works out the weather on the day, the wind over the actual ground you are flying from, and where each stage is likely to come down. It shows what is in the way, how likely you are to land on each hazard, and where to stand so your radio tracker hears the whole landing zone.
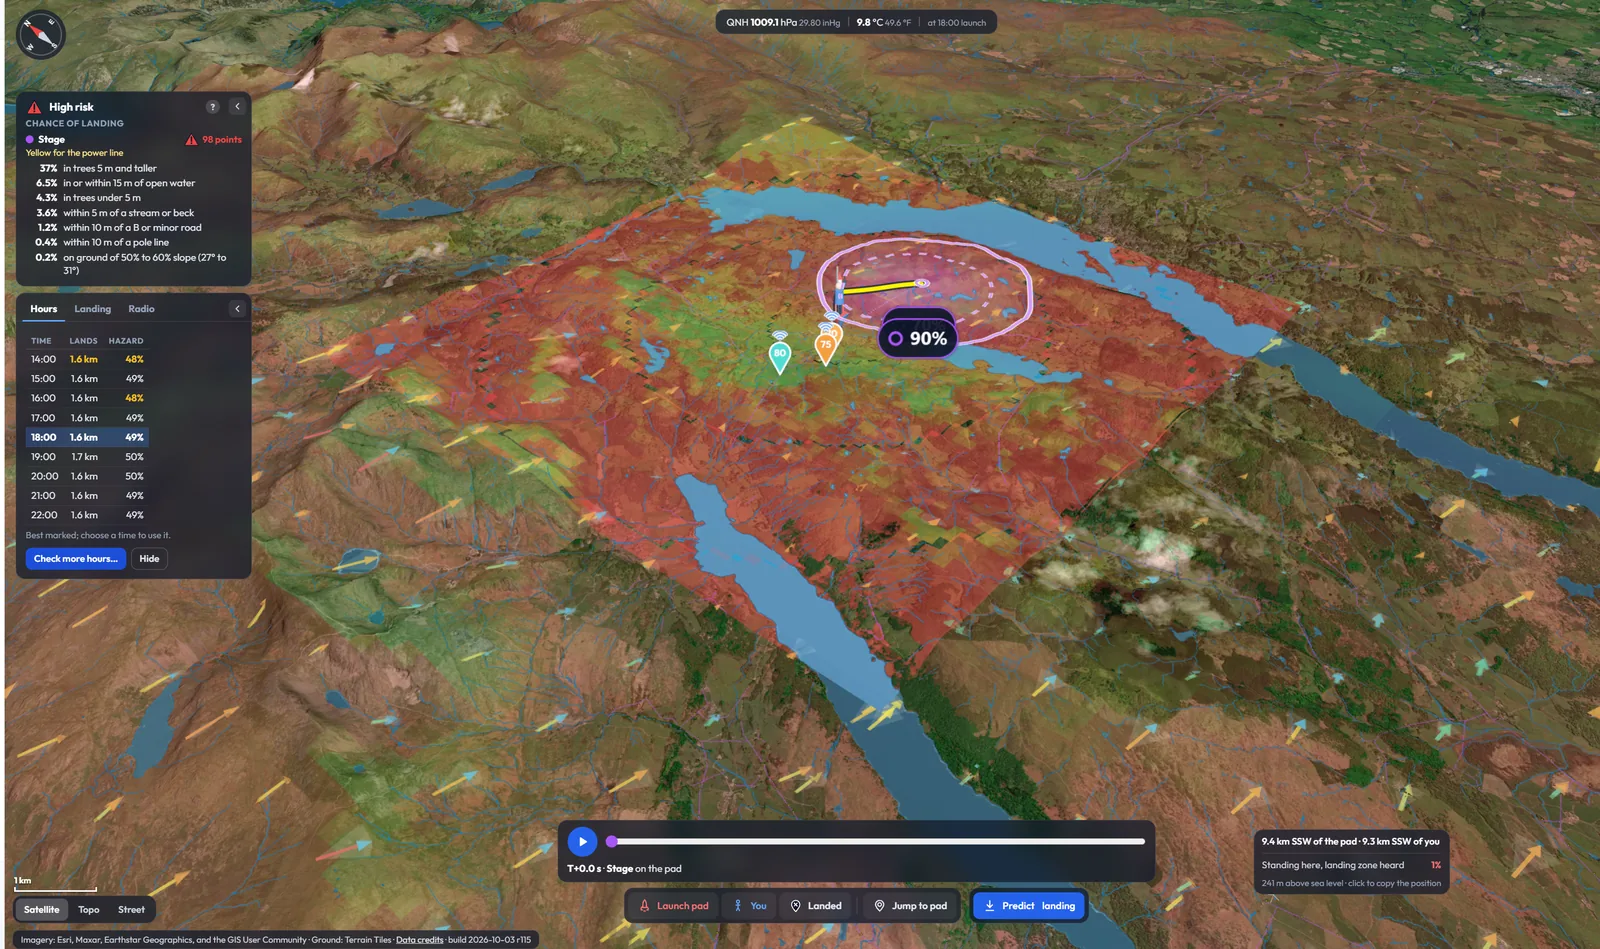
Everything you need to know about the field, before you go
One survey brings together the forecast, the ground and your rocket, so you can plan the flight, the recovery and the launch time together.
Landing prediction
Thousands of flights, each through its own wind, give the landing zone as two lines: where 70% and 90% of landings fall. Drogue and main, ejection delays and two stages are all included.
The wind over the ground
Hills speed the wind up over the top and slow it behind, woodland and rough ground hold it back, and lakes let it run. The forecast wind is shaped to the terrain, trees and ground cover round your site, with thermals added on sunny days.
Weathercocking
A rocket turns into the wind as it leaves the rail, so it climbs upwind before it drifts back. That is worked out from your rocket’s own stability and the motor’s real thrust curve, not a rule of thumb.
Hazards and risk
Every landing is checked against trees, open water, streams, roads, railways, power lines and steep ground, giving the chance of each and an overall risk for the flight.
Radio and where to stand
For LoRa and similar trackers, the map shows how much of the landing zone you would hear from each spot round you, and pins mark the nearest places that hear more, so you know where to walk before you launch.
The best hour to fly
Compare the hours either side of your launch time for how far it drifts and what it might land on, and pick the hour that keeps the rocket on the field.
From the forecast to the landing zone
The prediction is built in four steps, each one using the real data for your site and your rocket.
The weather
Forecast winds for your site and hour from NOAA’s GFS model, from about three months back to ten days ahead. Its ensemble of forecasts, held from 50 days back, gives the spread a single forecast cannot pin down.
The wind over the ground
A forecast is a broad picture kilometres across. It is reshaped over the real terrain with the same family of flow models used to site wind turbines, then trees, ground cover, lakes and turbine wakes are added.
The flight
Your rocket leaves the rail through that wind on the motor’s real thrust curve, weathercocking as it climbs, then descends under drogue and main. Load an OpenRocket or RockSim file, or a flight from AltimeterCloud, and its own figures are used.
Thousands of landings
Each flight gets its own wind from the ensemble, with gusts and turbulence, and the landings are gathered into the 70% and 90% lines along with the chance of each hazard.
Frequently asked questions
The full detail of every setting and figure is in the manual, from the Manual button at the top of the tool.
Is the Launch Site Survey free?
Yes. Everything works without an account. Logging in keeps your settings, saved weather and rocket setups for next time.
Does it work anywhere in the world?
Yes. The terrain, trees, water, roads, railways, power lines and wind turbines all come from worldwide datasets, and the weather from NOAA's global forecast model, so any launch site on land can be surveyed.
How far ahead can I check a launch?
From about three months back to ten days ahead. The further out the forecast, the less certain the wind, and the landing zone widens to show it.
How accurate is the landing prediction?
It can only be as good as the forecast, and the wind near the ground is the hardest part to forecast, so the prediction is drawn as a zone rather than a single point. Over many flights about nine in ten should land inside the 90% line. The terrain wind has been checked against published field measurements over hills, and predictions are compared with real landings as they are logged. It is least sure close behind steep hills and crags, where the air can break away from the ground.
How is this different from the drift in OpenRocket or RockSim?
A simulator flies your rocket through one wind over flat ground. The Launch Site Survey flies thousands of flights through forecast winds shaped by the real hills, trees and ground cover around your site, lands each one on the real ground, and counts what they come down on. Load your .ork or .rkt file and it uses your own design's figures.
Does it handle dual deploy and two-stage rockets?
Yes. Drogue and main with the main at your chosen height, ejection delays, and two stages, each stage with its own landing zone.
Which radio trackers does the radio part cover?
LoRa trackers and other low-power radios. Set the frequency, power, spreading factor and aerials, and it works out the signal over the real terrain and trees between the rocket on the ground and you, then shows where to stand to hear the most of the landing zone.
Can I use the prediction in my own software?
Yes. The landing prediction, and the weather, terrain, trees, water, roads, power lines, wind turbines and line of sight data behind it, are available through the AltimeterCloud API, listed in the tool's API menu.
Ready to survey your launch site?
Pick the pad, set the time and press Predict landing. It is free, and no account is needed.