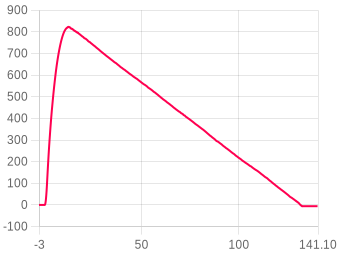
Distance
You can choose which units to use for distance from Meters(m), Feet(ft), Miles(mi) & Kilometers(km)
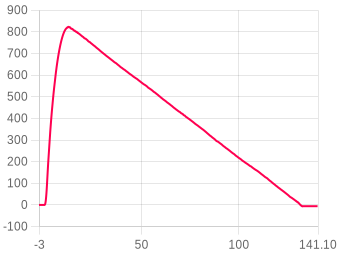
Velocity
You can pick which units to use for Velocity/speed such as Meters per second (m/s), Feet per second (ft/s), Miles per hour (mph) and Kilometers per hour (kph)
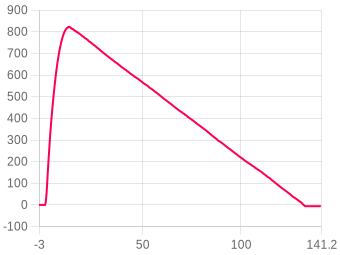
Acceleration
You can choose acceleration units to display from either Meters per second squared (m/s^2) or Gravity (G)
Flight 1786

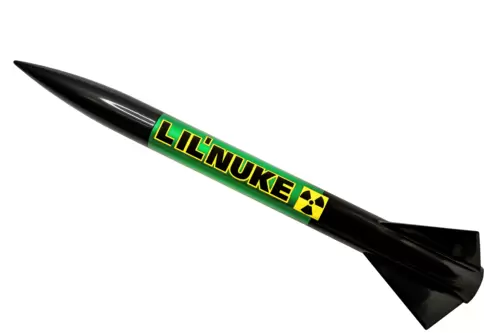
Lil Nuke - Flight with 4 altimeters - 3

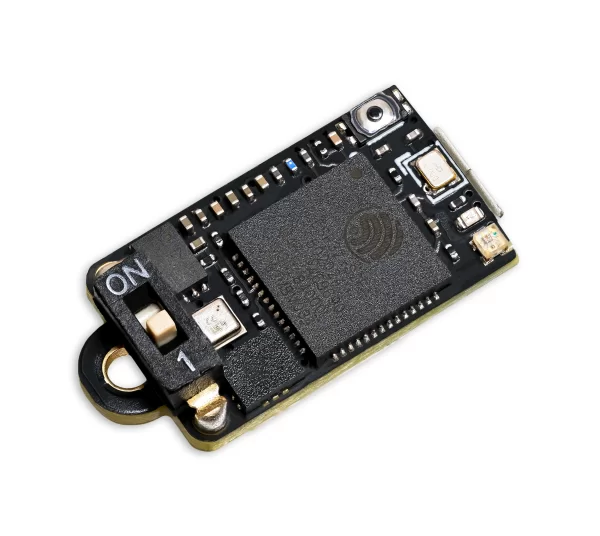
Nano V1 Rev 4 · firmware 1.52
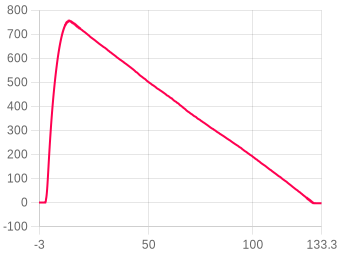
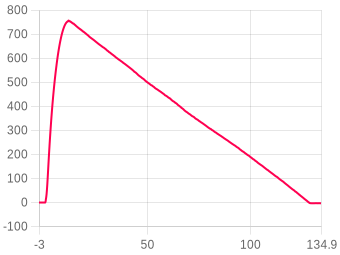
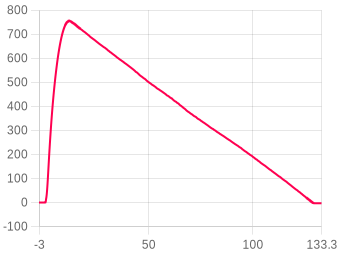
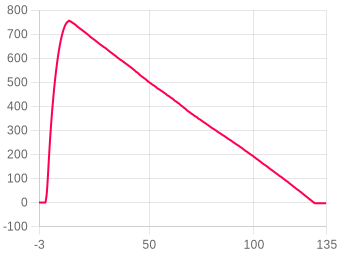
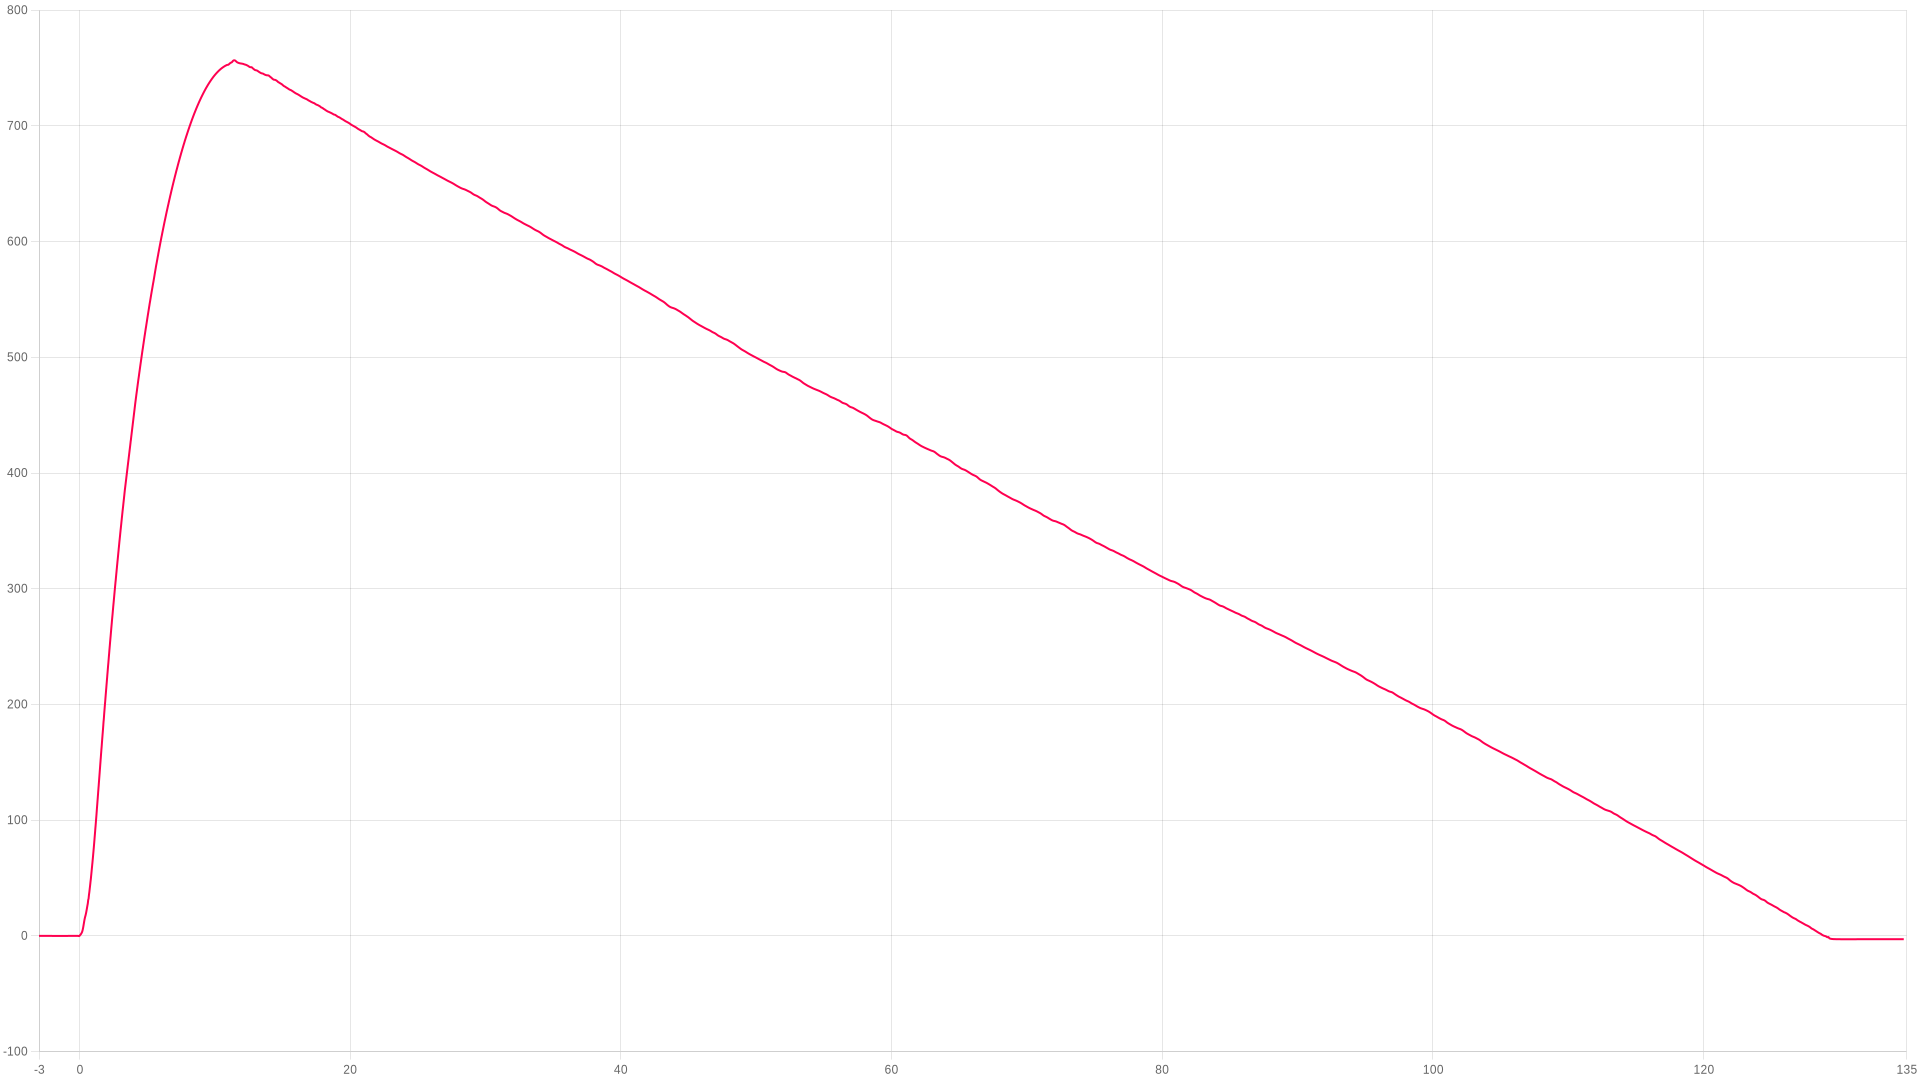
Apogee
756.68m
11.43 s after launch
Max ascent
156.91m/s
peak ascent
Max during burn
16.8G
during the burn
Landing
129.3s
touchdown 7.03 m/s
ZOOM TO
s
s
Show events
Adjust temp & pressure ?
Image
Zooming
Drag to zoom, pinch on mobile
Compare flight ?
Flight summary

The flight, moment by moment

Liftoff
0 s
Launch pad tilt20.14°
Thrust calc pad tilt2°
Launch detected
0.631 s
Altitude30.53 m
Velocity75.13 m/s
Burnout (first)
1.41 s
Altitude129.76 m
Velocity153.220 m/s
Possible ejection
1.863 s
Altitude198.65 m
Velocity144.82 m/s
Apogee
11.42 s
Altitude756.68 Meters
Max tilt to burnout23.66°
Landing
129.3 s
Altitude-2.04 m
Max descent-14.88 m/s

Stability86.4%Excellent

Launch straightness (20%)94.9
20% · Launch tilt 2°
Coning · full (25%)93.7
25% · Coning 25.7/53.2°/s
Coning · boost (25%)77.9
25% · Spin 452.2°/s
Thrust straightness (30%)82
30% · Thrust 96.2%

Rocket information

Calculated from the flight data alone
Boost acceleration108.7 m/s²
average over the burn · 11.1 g
Coast deceleration15.3 m/s²
average · gravity plus drag
Ballistic coefficient538 kg/m²
fitted to the 10.01 s coast
Apogee lost to tilt0.46 m
flown vertical ≈ 757.1 m · from the thrust-calculated tilt
Chute opening peak34.08 G
largest deceleration after ejection
Average descent rate1.57 m/s
ejection to landing · 127.44 s
Battery & temperature 88% → 82% · Temperature start 28.38 → 30.12 °C · Launch after startup 7m 6s

About the stability score

Worked out from the flight log between liftoff and 80% of apogee. It is independent of the angle the altimeter was mounted at, so it measures the flight rather than the fitting.

Launch straightness (20%)20%How close to vertical it left the rod.
Coning · full (25%)25%How much the nose swung off the rocket's own axis across the whole ascent.
Coning · boost (25%)25%The same swing during the burn, when it matters most.
Thrust straightness (30%)30%How cleanly the motor pushed along the body.

Spin about the rocket's own axis is not counted against it — a fast, straight spin is stable. The figures beside the score are the raw measurements behind these four.

Altitude
Apogee756.68 Meters
Time to apogee11.42 s
Burnout altitude129.76 m
Max velocity altitude148.03 m
Ejection altitude198.65 m
Landing altitude-2.04 m
Recording altitude42.09 m
Velocity
Max ascent156.91 m/s
Max descent-14.88 m/s
At burnout153.220 m/s
Descent velocity-6.481 m/s
Ejection velocity144.82 m/s
Landing velocity-7.028 m/s
Acceleration
Max during burn16.8 G
Max ascent31.02 G
Max descent34.08 G
Average ascent1.25 G
Average burn11.62 G
Times
Burnout (first)1.41 s
Apogee11.42 s
Possible ejection1.863 s
Landing129.3 s
Angles
Launch pad tilt20.14°
Thrust calc pad tilt2°
Max tilt to burnout23.66°
Launch roll16.68°
Launch pitch10.67°
Max spin (burn)749.64 dps
Avg spin (burn)394.32 dps
Recovery
Single deploy
No dual deploy detected on this flight.
General
Upload date14/06/26-19:43:44
Data samples11536
Total recording time148.089 s
Average samples/s77.8
Number of lockouts0
Launch after startup7m 6s
Reference axisX
Battery & temperature
Battery start88%
Battery end82%
Temperature start28.38°C
Temperature end30.12°C
User notes

A test of 2x Mercury and 2x Nano altimeters in a Lil Nuke with a G80 Aerotech motors.
Add this device to your account to edit
Youtube video
No video added
Add this device to your account to edit
Flight images 0
No images added
Groups
Flight motors
1st stage · 10s delay
1×G80T-10AeroTechDetails
Burn time
1.7 s
Diameter
29.00 mm
Average thrust
77.6 N
Max thrust
108.5 N
Total weight
127.90 g
Propellant weight
62.50 g
Propellant type
Blue Thunder
Impulse136.6Ns
Max thrust108.5N
Burn time1.7s
Impulse classG
1st stage thrustloading curve…
Motor data by ThrustCurve.org
Add this device to your account to edit
Linked rocket
Active
1 photo
My Lil Nuke #1
LOC Precision — Lil' Nuke
8 flights linked
Type
Kit build
Diameter
57.4mm
Length
749.3mm
Dry weight
368.5g
Mod
Modified
Stages
1
Fins
3
Recovery
Parachute
Chute
61cm
Body
Loc paper tube
💬 7 comments · 👍 2 reactions
Sim data from sim files
MotorAltVelAccelApogeeSource
Estes A8-3135.3 m64.8 m/s29.6 G4.5 sRockSim (estes_viking.rkt)
Estes B4-4282.9 m105.3 m/s30.0 G6.1 sRockSim (estes_viking.rkt)
Estes B6-4288.1 m116.9 m/s31.0 G5.9 sRockSim (estes_viking.rkt)
Estes C6-5475.1 m171.4 m/s34.4 G7.5 sRockSim (estes_viking.rkt)
Estes C6-7483.1 m171.4 m/s34.4 G8.1 sRockSim (estes_viking.rkt)

Linked flights

Connect flights that belong together: a second altimeter flown in the same rocket, or the same rocket flown again. Linked flights appear on each other’s pages.

No linked flights yet.

Launch site, date & time

Click anywhere on the map to mark your launch site. Switch between map and satellite view using the buttons below.

Imagery © Esri, Maxar, Earthstar Geographics

Click the map to place a marker · Drag to adjust

Canopy height from the Meta and WRI High Resolution Canopy Height Maps v2 (Meta and World Resources Institute, 2026; source imagery © 2016 Vantor), used under CC BY 4.0. Ground elevation built from Terrain Tiles (Mapzen and AWS Open Data), derived from 3DEP and GMTED courtesy of the U.S. Geological Survey, SRTM courtesy of NASA, and ETOPO1 courtesy of NOAA. Map and imagery credited on the view above.

Site nameUnnamed siteLat52.668530Lng-1.522845Ground level106.5 m · 349 ftLaunch date2026-06-14Launch time14:00
Flight data animation

FLIGHT 1786

756.68 Meters

ALTITUDE
0.00m
VELOCITY
0.00m/s
ACCEL
0.00G
TILT
0.00°
PITCH
0.00°
ROLL
0.00°
YAW
0.00°
TIME
0.00s
AWAITING LAUNCH
ALT
altimetercloud.com
LAUNCH T+0.00s LANDING

BURNOUT

Motor burn complete

Note: Flight profile animation requires your altimeter to be mounted in a fixed orientation that you choose in your settings. For best results please calibrate your sensors as well.
Nano V1
Revision 4
Nano V1
This flight was flown on a Nano V1.
The hardware
Hardware versionRev 4
Software version1.52
Last online14/06/26-19:43:44
Pressure sensorBosch BMP 581
Accelerometer32G 3-axis
Gyroscope2000 dgps 3-axis

Settings, as they were for this flight

General flight settings
Forecast pressure
i
Set this to your local forecast pressure at sea level. This will offer you slightly improved accuracty for your flight, although it's not 100% essential every little helps!

Xcweather.co.uk is a decent place to grab pressures from for your location and time.
1013.2 mbar
Launch detect
i
This is the altitude above the launch pad altitude where the altimeter will trigger itself into recording / flight mode.

The altimeter keeps a constant average of the pressure while waiting for launch, it uses a simple algorithm and the pre-flight buffers to do this. The most recent 120 samples (~4 seconds) are ignored so your pre-trigger altitude won't effect the ground baseline.

For almost all uses we suggest keeping this on the 25 Meter (~82 feet) default settings. If you want to test your altimeter by throwing it in the air, or are planning a very low flight you may want to lower the setting.
30 meters
Sample ratio
i
The altimeter runs at 50Hz however you can record every sample or every X samples in order to extend the log time. For example if you set the ratio to 1 it will save 1:1 samples, or if you set it to 3 it will save 1 in 3 samples.
1:1:1 (200Hz)
Max samples
i
This is the maximum samples the altimeter will log per flight. When it reaches this amount it will stop and save the recording.
24000
Recording stop
i
This setting is how the altimeter decides to stop recording. You can choose either 450 (~9s) or 900 (~18s) samples stable or it will record until the max samples limit unless you press the BUTTON in Manual stop mode.

The samples stable method waits for the devices altitude not to change for the set number of samples. This is defined by not changing by more than +/- 1.0 meters for 98% of the samples, it's a reliable method to stop the recording after landing within 8-10 seconds (300 sample) or 16-20 seconds (600 sample).
Auto: 8s stable altitude
Oversampling
i
Oversampling is a internal setting of the BMP 390 pressure sensor. It is how many samples are taken for each reading. By taking multiple samples for each pressure reading the altimeter reduces noise and increases the resolution of the output.

The sensor can run at 50 samples per second in 4X mode, so we suggest leaving it in this mode as it will offer the highest accuracy.
16x Oversampling
IIR filter
i
The IIR filter is another internal sensor for the BMP390 pressure sensor. It is a Infinite impulse response filter used to enhance pressure measurement accuracy by reducing noise. It's primarily for smoothing out rapid pressure changes.

We suggest not setting this too high as it will cause delay to changes in altitude if set very high.
COEFF 7
Pressure filter
i
This filter is a software Kalman filter that runs on the altimeters processor.

The Kalman filter uses a prediction step based on a system model and then a correction step using new measurements to refine its estimate, it creates accurate most certain results from data with noise in it.
TruePath
Sample speed
i
The sample rate of the altimeter's sensors. 50Hz takes 50 samples per second, 100Hz takes 100 samples per second for higher resolution data.
200 Hz
Hybrid mode
i
When enabled, the altimeter records at full speed during ascent then switches to half speed after apogee to extend recording time during descent.
Enabled
Sync sensors
i
The filters on the pressure sensor can cause it to lag very slightly behind the Accelerometer and Gyroscope data. The Sync sensors option detects how far out of sync these sensors are. It then corrects the Acceleration and Gyroscope readings to match the pressure sensor.
ENABLED (24 samples / 140ms)
Orientation
i
This is the orientation you intend to install the Altimeter in your rocket. It's needed to ensure completly accurate angles and orientation charts and reports. Check out the Manual for more information on this.
Down (text up)
IMU filter
i
The IMU filter, or fusion filter takes the data from each axis of the Gyroscope and Accelerometer to calculate the Pitch, Roll, Yaw and tilt angle from vertical. These filters can build up some discrepency over time so it's important to calibrate your sensors to minimise this.
Madgwick 6-Axis
Launch ALP
i
This is prevention against accidental launch detection.

With this disabled the launch is based only on pressure and something that creates a low pressure can trigger the flight by accident. For example pulling your nose cone off can even trigger it.

With this enabled the rocket also needs to have seen 8 samples (0.25 seconds) of acceleration above this setting in the last 3 seconds as well as the pressure drop to trigger. There is a backup trigger of 1.05 seconds of altitude being above the launch detect setting too.

There are very few situations where this option would cause issues, so we suggest leaving it on.
1.5G
Launch lock
i
When enabled, the altimeter locks out recording for a set period after power on to prevent false triggering during setup.
DISABLED
Static temperature
i
A fixed temperature value used for altitude calculation when the external temperature sensor is disabled or not connected.
15 °C
Sensor calibration
Calibration offsets used during this flight.
Gyroscope
X2.000°
Y0.000°
Z0.000°
Accelerometer⚠ Accelerometer has not been calibrated
X0.000 mG
Y0.000 mG
Z0.000 mG

Files

Where the altimeter signs its log, the file carries that signature and a tick beside it. A tick means the data is unchanged since the device wrote it, which is what a record claim needs.
CSV
1786.csv ✓ SIGNED
The log as columns of text. Opens in a spreadsheet, and in every simulator that reads flight data.
883 KB
WX
1786_weather.json.gz
The weather for 48 hours either side of the launch, within 15 km of the launch site: NOAA GFS every hour, at the surface and up to about 31 km, and the NOAA GEFS ensemble where this site holds it. JSON, gzip compressed. Weather data by Open-Meteo.com (CC BY 4.0) and NOAA. For 2026-06-14 14:00 local time at 52.6685, -1.5228.
196 KB
Adjusted CSV2904 recalculated in your browser
The log recomputed for your own sea-level pressure and temperature. Columns: time, altitude as recorded and adjusted, raw altitude as recorded and adjusted, pressure.

This file is built here from the signed log, so it carries no signature of its own. Anyone verifying a claim should be sent to the flight page and build their own from the original.

Flight
Comments
Sign in to leave a comment.